





Digests and alerts
Contents
Observations tell you what a scanner found. Digests and alerts push those findings to you on a schedule, so you don't have to keep opening the scanner to check. Both are configured on a scanner's Digests and alerts tab, and PostHog collectively calls them the scanner's actions.
- A digest runs on a fixed schedule (say, every weekday at 8am) and produces an AI-written summary of the observations from that period.
- An alert watches the scanner continuously and only notifies you when a condition you set is met – for example, when a monitor flags more than 20 sessions in a day.
Every run of either shows up on the scanner page and in the action's run history whether or not you've wired up a delivery destination, so a broken Slack channel or unreachable webhook never hides the result.
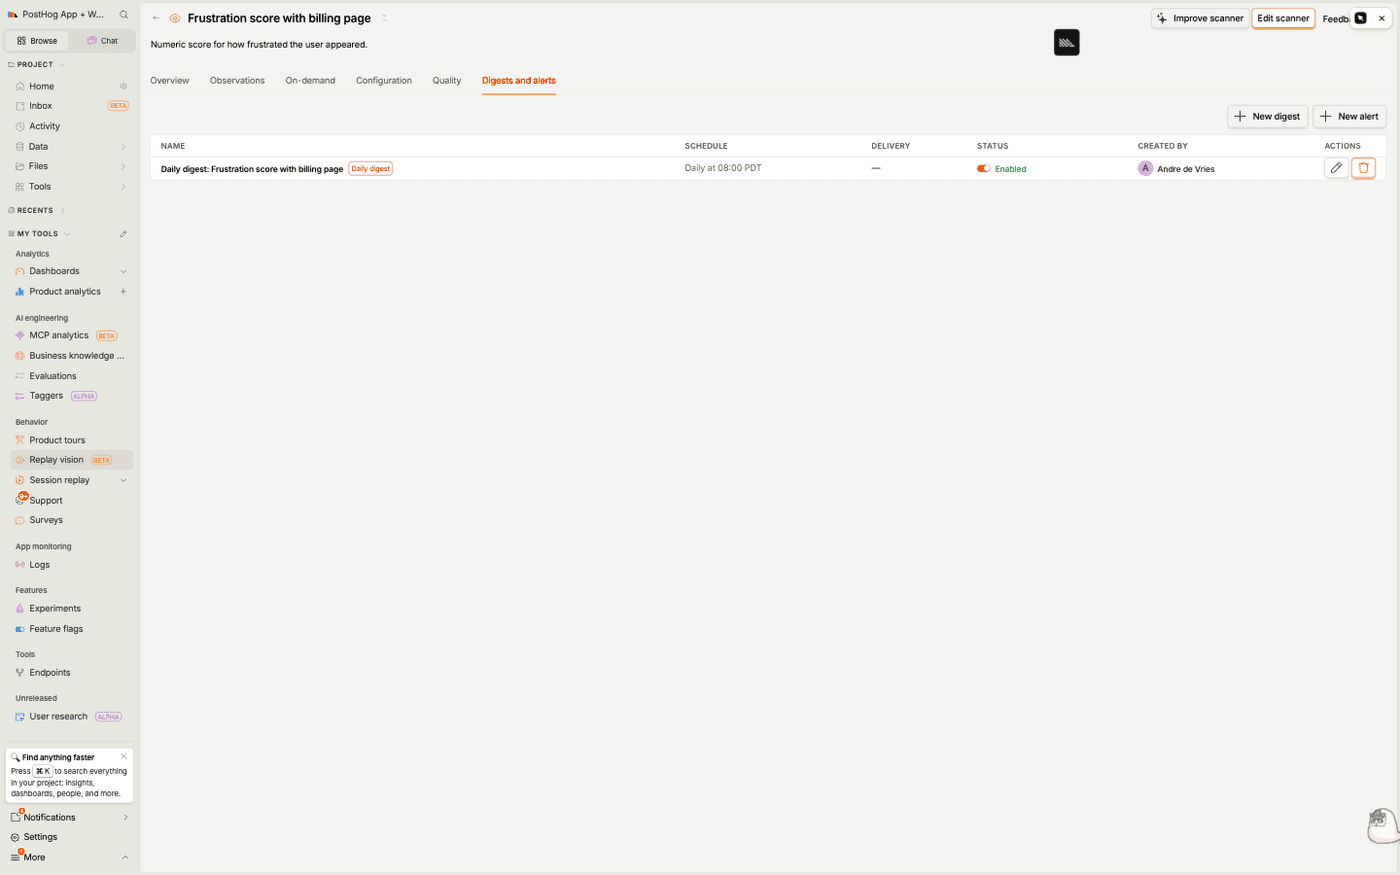
Digests
A digest answers "what did this scanner see recently?" without you watching a single recording. On each scheduled run, PostHog gathers the scanner's observations from the period, hands them to a Google Gemini model, and asks it to write a narrative summary with citations back to the individual sessions.
Creating a digest
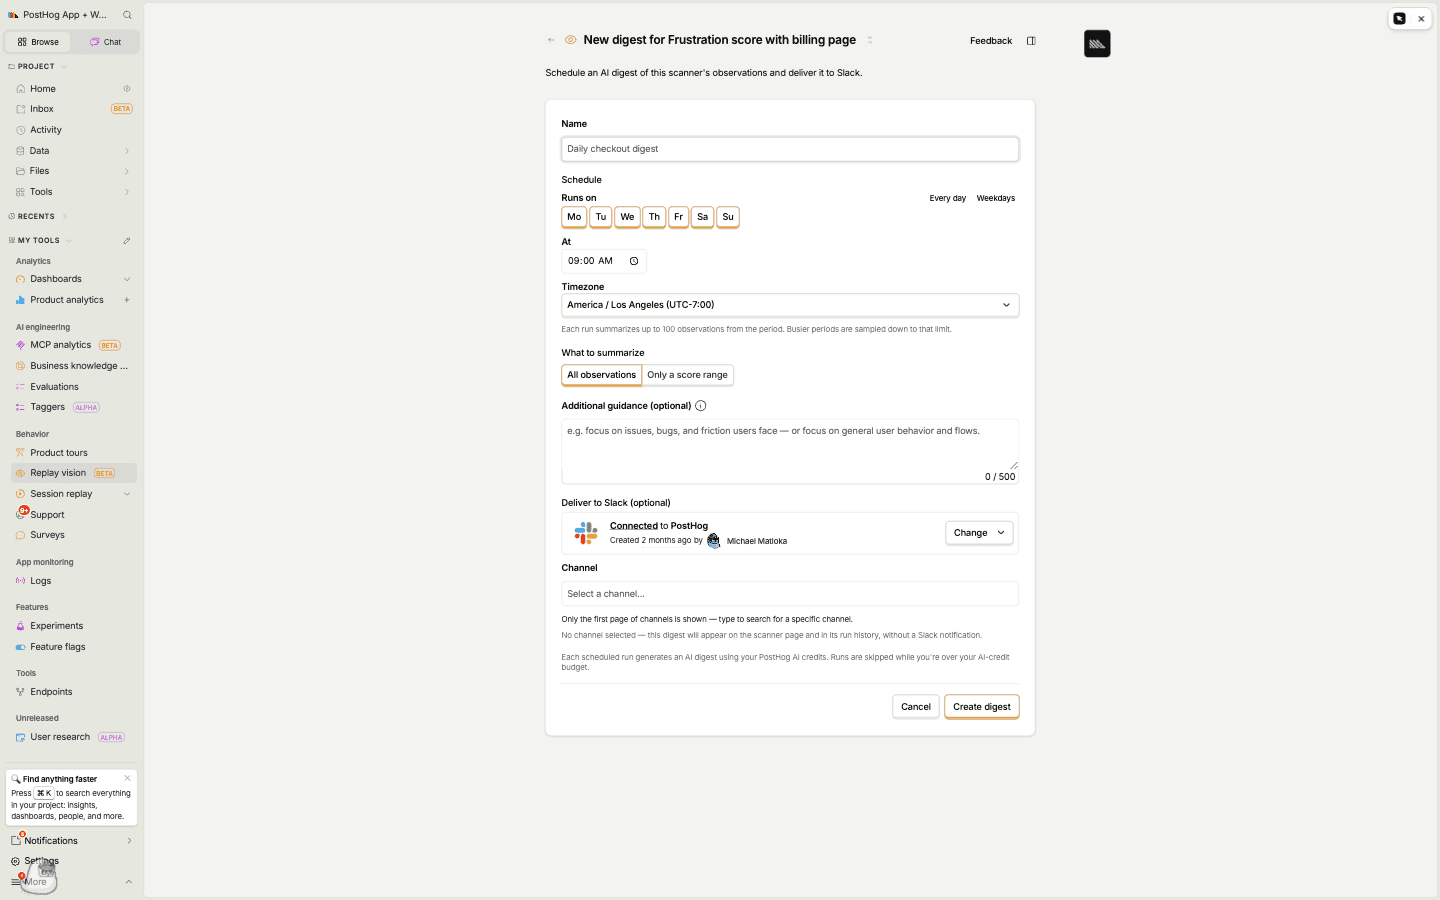
On a scanner's Digests and alerts tab, click New digest and fill in:
- Name – how the digest appears in the list and in delivered reports.
- Schedule – the days it runs (every day, weekdays, or a custom set), the time of day, and the timezone. Each run summarizes up to 100 observations from the period; busier periods are sampled down to that limit.
- What to summarize – All observations, or a narrower slice scoped to the scanner type. A monitor can summarize only certain verdicts, a scorer only a score range, and a classifier only certain tags. Summarizers always summarize all observations.
- Additional guidance (optional) – a short prompt that steers the summary, e.g. "focus on bugs and friction users hit" versus "describe general user behavior and flows." Leave it blank and the model summarizes freely.
- Deliver to Slack (optional) – pick a connected Slack channel to post the report to. You can also deliver to a webhook instead of, or alongside, Slack.
The digest report
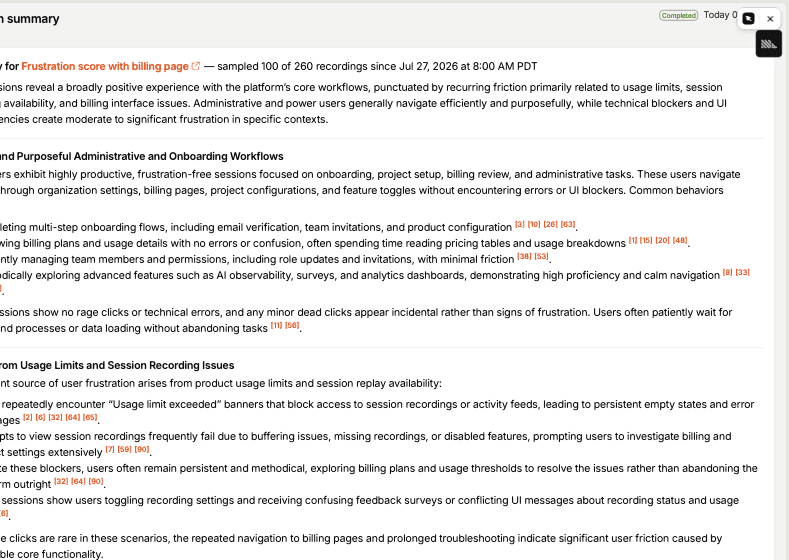
Each run produces a Markdown report: a headline takeaway, then themed sections grouping what the scanner saw. Numbered citations like [3] link straight to the observation – and the session – that backs each claim, so you can jump from a pattern to the recording behind it.
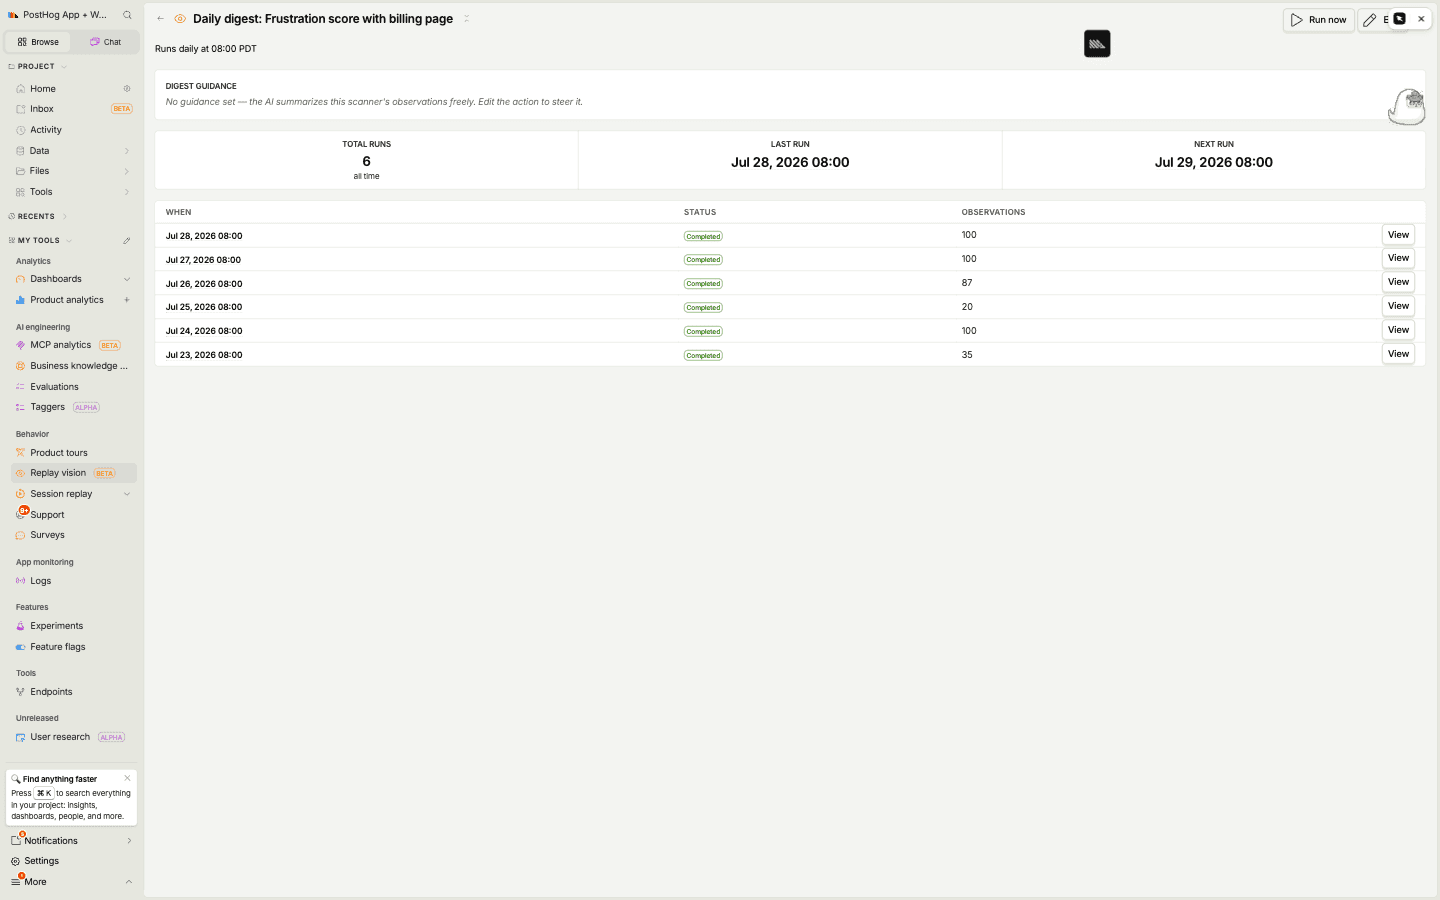
Open the digest itself to see its run history – how many observations each run covered, when it last ran, and when it runs next. Run now triggers an off-schedule run against the current period, which is handy while you're tuning the guidance.
Each scheduled run spends PostHog AI credits. Runs are skipped while you're over your AI-credit budget.
Alerts
Where a digest tells you what happened on a cadence you set, an alert stays quiet until something you care about happens. You define a condition against the scanner's output, and PostHog notifies you only when it's met.
Creating an alert
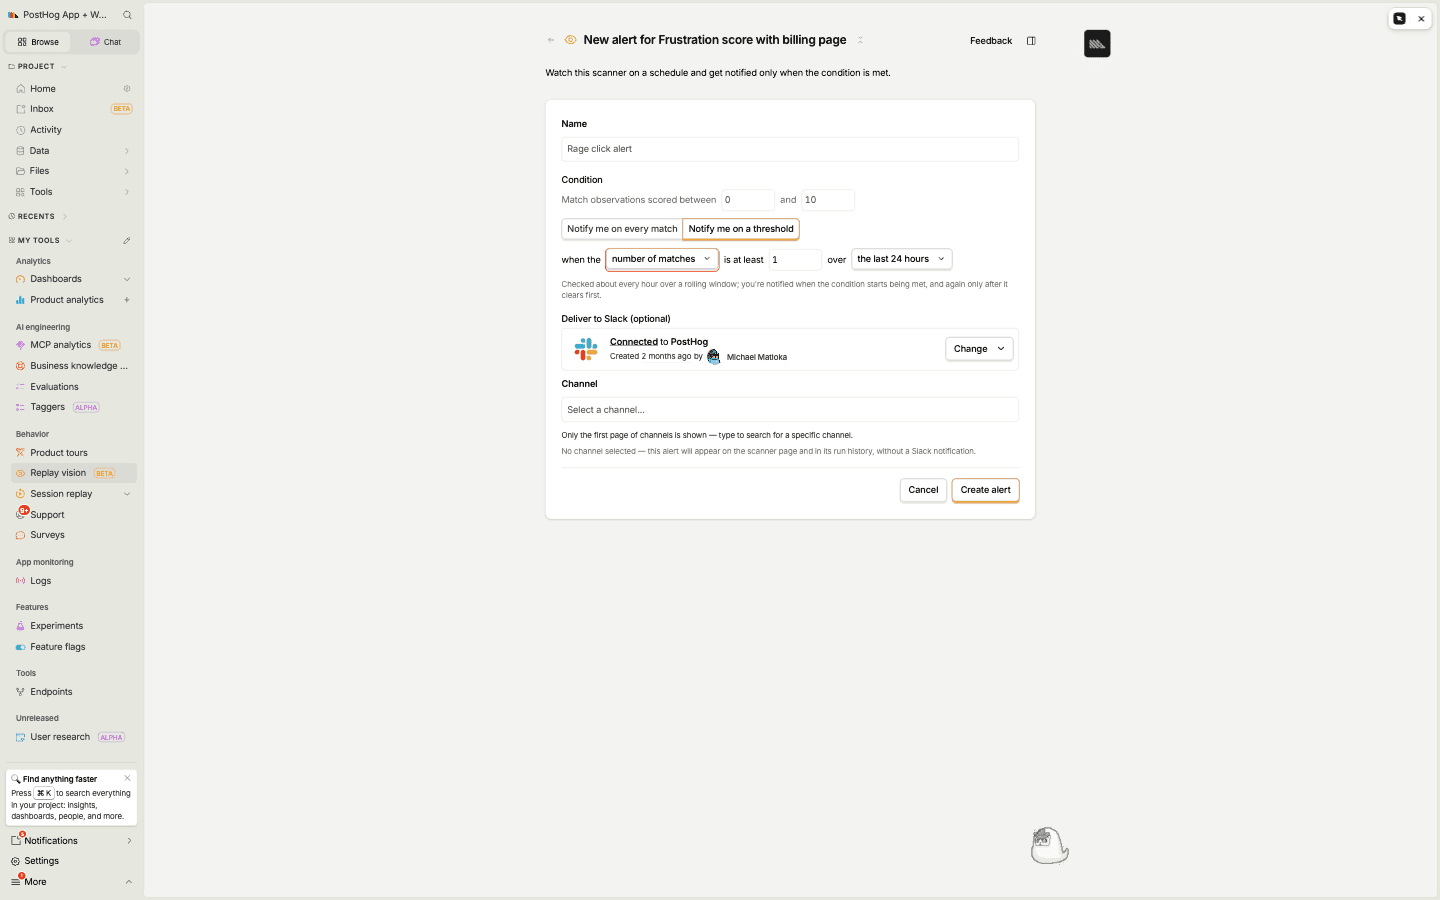
On a scanner's Digests and alerts tab, click New alert and fill in:
- Name – how the alert appears in the list and in notifications.
- Condition – which observations count as a match. This mirrors the scanner type:
- Monitor – observations with a given verdict (
Yes,No, orInconclusive). - Classifier – observations tagged with a specific tag.
- Scorer – observations scored within a range you set.
- Summarizer – summarizers don't have a categorical output, so they aren't a good fit for alerts. Use a digest instead.
- Monitor – observations with a given verdict (
- When to notify – either on every match (checked every few minutes; each notification covers the new matches since the last check) or on a threshold (checked about hourly over a rolling window). A threshold fires when the metric – the number of matches, or for a scorer the average score – reaches your limit over the window, and you're notified again only after it clears first, so a persistent problem doesn't spam you.
- Deliver to Slack (optional) – same as digests: a connected Slack channel, a webhook, or both.
Fired and recovered
A threshold alert has two states. When the condition starts being met it fires; when a later check finds the condition no longer met it recovers. Both are separate notifications, so you can wire "dead-end rate is spiking" and "dead-end rate is back to normal" into the same channel. (A webhook receives these as replay_vision.alert_fired and replay_vision.alert_recovered.) An "on every match" alert has no recovered state – it just sends the new matches each check.
Delivery
Both digests and alerts can post to Slack, to a webhook, or to both at once. Delivery is optional: leave it unset and the report still lands on the scanner page and in the action's run history, so nothing is lost if a channel is misconfigured or an endpoint is down.
Webhooks
Instead of, or alongside, Slack, you can have a digest or alert deliver to a webhook. When it fires, PostHog sends an HTTP POST with a JSON body to the URL you set on the action.
To set one up:
- Open a scanner and create or edit a digest or an alert.
- Under Delivery, choose Webhook.
- Paste the URL of the endpoint that should receive the payload.
- Save.
Request
- Method:
POST - Headers:
Content-Type: application/jsonX-PostHog-Webhook-Version: 1– the payload version. New fields may be added to the body without changing this, so ignore unknown fields rather than rejecting the payload. A breaking change would ship under a new version.
Payload
The body is a JSON envelope. type tells you what happened; data carries the report and links.
| Field | Type | Description |
|---|---|---|
id | string | Unique ID for this delivery. Equal to data.run_id; use it to dedupe retries. |
type | string | One of replay_vision.digest, replay_vision.alert_fired, or replay_vision.alert_recovered. Route on this. |
timestamp | string | ISO 8601 time the run was scheduled. |
data.vision_action_id | string | ID of the digest or alert. |
data.run_id | string | ID of this specific run. |
data.scanner_id | string | null | ID of the scanner the action belongs to. |
data.action_name | string | Name of the digest or alert. |
data.scanner_name | string | null | Name of the scanner. |
data.observation_count | number | How many observations this run matched. |
data.report | string | The report as Markdown. |
data.run_url | string | Link to the run in PostHog, showing every matching observation. |
The type field tells you which event fired:
replay_vision.digest– a scheduled digest produced its summary.replay_vision.alert_fired– an alert's condition was met.replay_vision.alert_recovered– an alert that was firing has cleared.
Digests and alerts vs. insight alerts
Because every observation is also a $recording_observed event, you have a second, more general way to get notified: build an insight on those events and put a standard alert on it.
Reach for a scanner digest or alert when you want the finding itself – the AI narrative, the matching sessions, links straight to the recordings. Reach for an insight alert when you want to threshold a metric derived from observations (a rate, a percentile, a comparison against other events) using the full power of PostHog's SQL.